Arduino I/O and Dynamic Graphing with R and the Manipulate library
Recently, our lab has been working on a general timing measurement system to ensure that psychophysical timing of experiments is valid with different experimental setups ranging from calibrated lab CRT monitors to LCD projectors in MRI facilities.
Essentially, we aim to have a portable and easy to use recorder of digital and analogue signals that can be analysed for delays in hardware and software as well as jitter in various parameters. Our sensors will be signals from eye trackers, photodiodes on displays and manual responses as well as synchronised triggers sent to and from MRI and MEG machines.
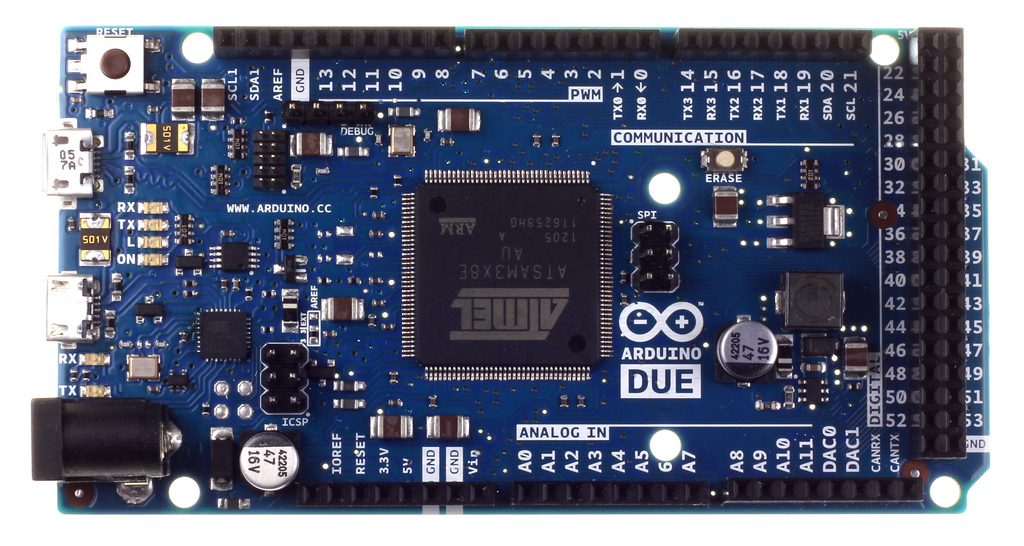
The hardware we have chosen for this is the very affordable and powerful Arduino Due. The Due is a great match for general purpose I/O, it has:
- a 32 bit ARM microcontroller running at 84MHz
- 96Kb of SRAM and 512Kb of Flash memory
- 54 digital I/O pins
- 12 analog inputs (at 12 bit resolution)
- 2 DACs than can output audio at 12bit resolution
- a USB connector compliant with USB host protocol
The main reason to use Arduino, however, is the variety of software available and the relatively straightforward programming environment.
After some initial hand coding with success at low bitrates, I found Prof. Chris Rorden’s excellent
Oscilloscope using Teensy or Arduino page. This page describes in detail and provides software for using the Arduino as a general purpose oscilloscope/recorder.
Essentially, one first uploads an arduino “sketch” to the board called stimsyncArd. Then the arduino will establish a high speed serial-over-USB link to the test computer and pass incoming signals as serial data. The software osciLaz does the job of displaying and recording the data but it can also be displayed directly in MATLAB or Processing.
The data quality is excellent, our setup is running rock solid at 1000Hz which produces data adequate for quite fine grained timing. The software is cross platform but I have mostly tested it in OS X.
Prof Rorden also has a data viewer for the resulting .EDF files, called ELEcro. However, as we generally do most of our analyses in R, I wanted to have a general purpose viewing script for the data. I haven’t located an EDF importer for R yet (although this may be close). However, there are many options for exporting to ASCII, ELEcro exports as a tab separatated file and fieldtrip in MATLAB can also export files.
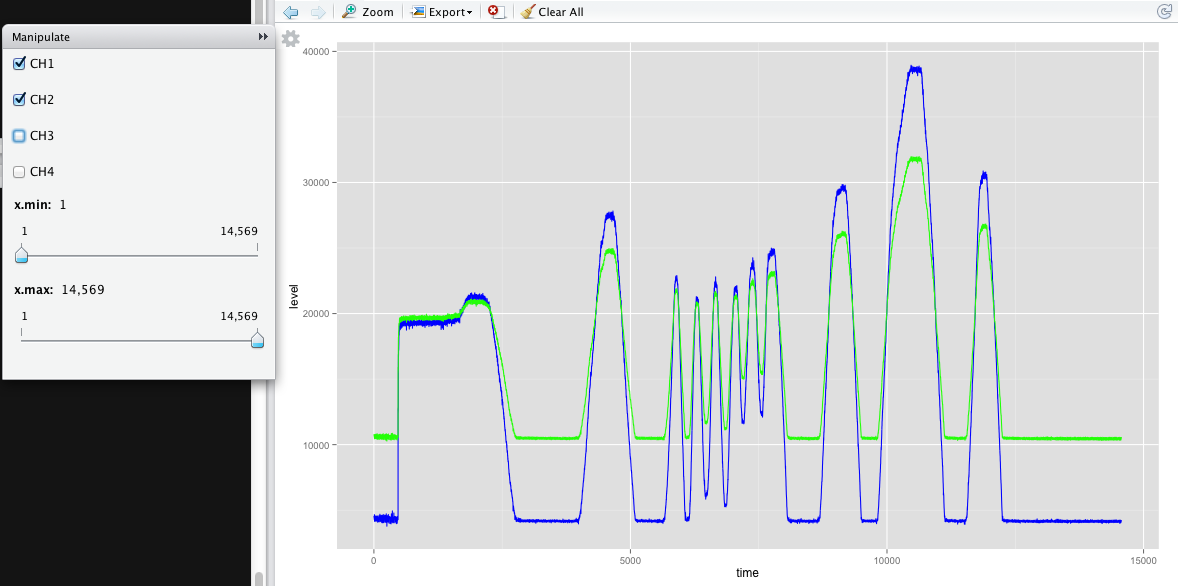
Once the data is imported into R, I needed a flexible way to view the data, here’s a script which does the job nicely using the “manipulate” library:
# reads from MATLAB output by fieldtrip or ELEcro tab export

datatype="ELEcro"
#datatype=MATLAB

if (datatype=="ELEcro"){
  filename<-file.choose()
  sample_rate<-read.table(filename,skip=1,nrows=1)[1,1]
  data<-read.table(filename,col.names=c("ch1","ch2","ch3","ch4"),header=TRUE, skip=3)
  data$time<-as.numeric(rownames(data))/sample_rate*1000  # correct for sample rate
} else
data<-read.csv(file.choose(),col.names=c("time","ch1","ch2","ch3","ch4"))
}

# use manipulate library to make an interactive plotter

manipulate({

  p <- ggplot() + ylab("level")
    if(ch1_on==TRUE) p<-p + geom_line(data=data, aes(time,ch1),colour="blue")
    if(ch2_on==TRUE) p<-p + geom_line(data=data, aes(time,ch2),colour="green")
    if(ch3_on==TRUE) p<-p + geom_line(data=data, aes(time,ch3),colour="orange")
    if(ch4_on==TRUE) p<-p + geom_line(data=data, aes(time,ch4),colour="red")
  p + xlim(x.min,x.max)
},
          ch1_on = checkbox(TRUE, "CH1"),
          ch2_on = checkbox(TRUE, "CH2"),
          ch3_on = checkbox(TRUE, "CH3"),
          ch4_on = checkbox(TRUE, "CH4"),
          x.min=slider(min(data$time),max(data$time),initial=min(data$time)),
          x.max=slider(min(data$time),max(data$time),initial=max(data$time))
  )
The resulting graph can be manipulated to show specific channels or time ranges. This general approach works well for dynamic graphing in R and is compatible with RStudio and RStudio-server.