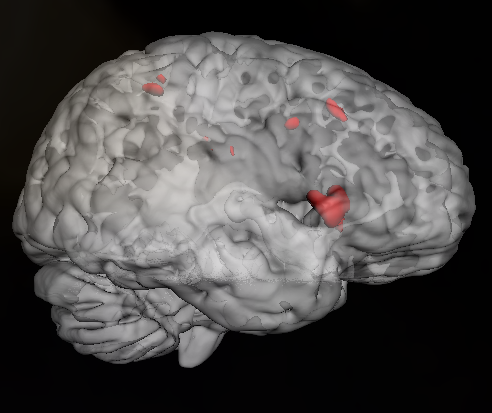
Publishing fMRI results usually involves the presentation of slice images that show regions of increased BOLD (Blood Oxygen Dependent Signal). However, fMRI data is inherently three dimensional and often it is difficult to visualise or appropriately present data in 2D formats.
Therefore, it can be useful to implement a method for displaying graphics in 3D form. Luckily, there are some good javascript libraries that interact with the HTML5 canvas attribute to present 3D objects.